User Guide of Touch NMR
There are five spectrum operation icons on the toolbar. From left to right are: phase correction, baseline correction, reference, peak finding, integration.
Click the phase correction icon, the phase correction will be active. And the phase correction control panel will be called out. As is shown in figure 30.
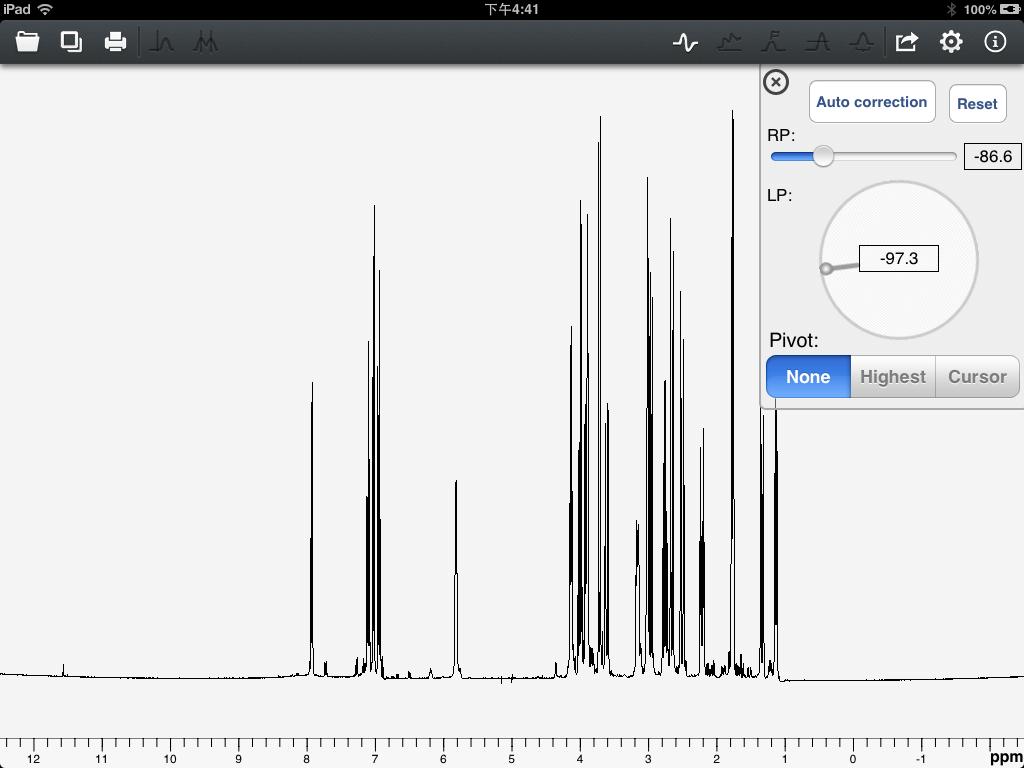
Figure 30
Click the "Auto correction" button on the phase correction control panel, app will calculate to find perfect phase. Because the algorithm is complex, the calculation requires relatively a long time. Click the "Reset" button, the phase will be reset to initial. RP(Zero-order phase factor) varies between -180 to 180 degrees. LP(First-order phase factor) can be adjusted by rotating the cicle. And both can be tapped in a precise value by clicking the digital box. You can also select to do the "Pivot" correction. By clicking the "Highest" segment, the cursor will automatically point to the highest peak of the spectrum. At the meantime, the RP value will change according to the LP value to ensure that the phase of the highest peak remains the same. And if you click the "Cursor" segment, the phase of the point at cursor position will remains the same when you adjust the LP value.
Click the baseline correction icon, a control panel as shown in figure 31 will appear. Current version, Touch NMR only provides the function of "Auto correction".
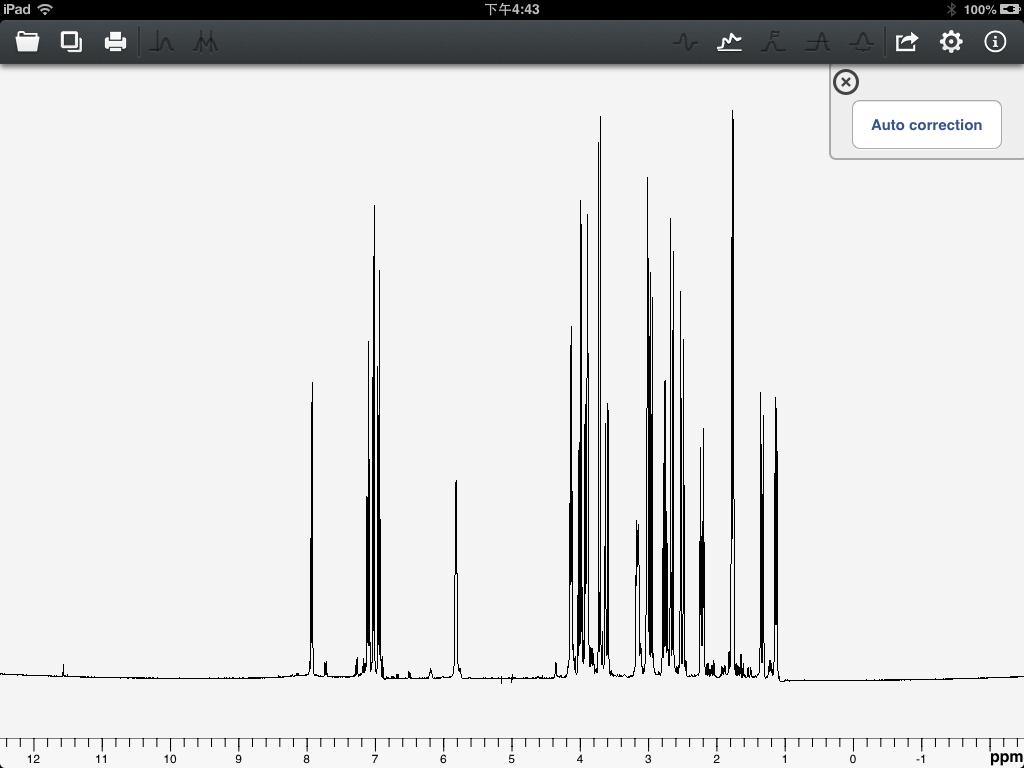
Figure 31
The reference operation is shown in figure 32.
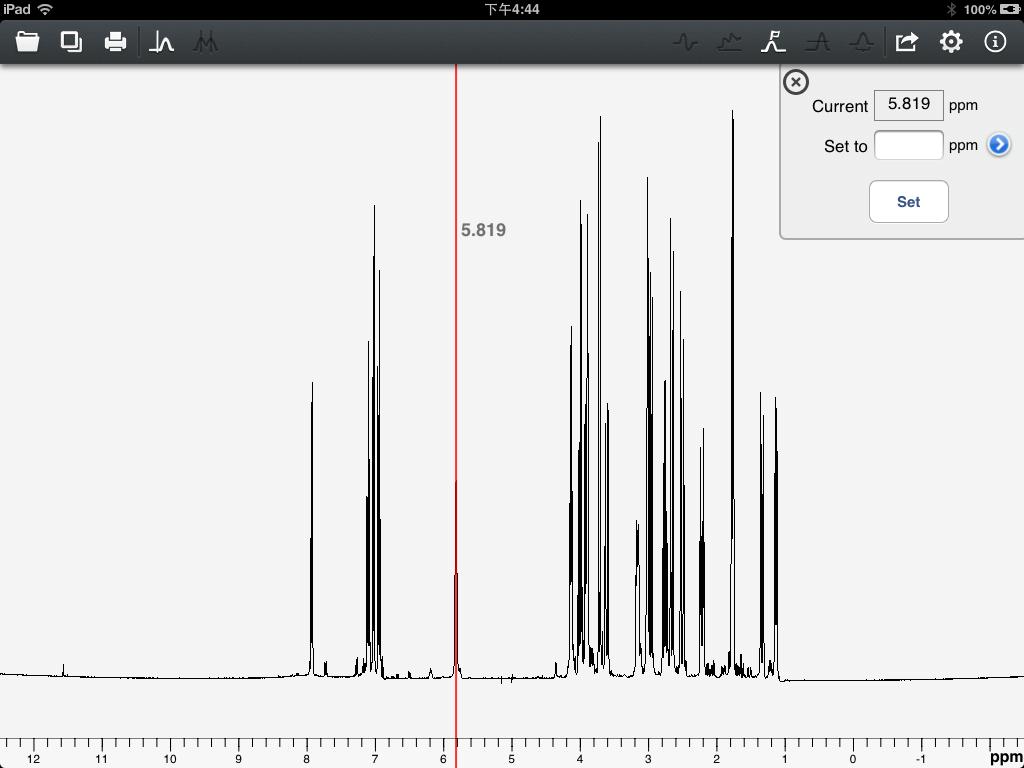
Figure 32
The current position is the position of the cursor, and users can move to another location by tapping in a number. Users can select the app's built-in reference data by clicking the "blue arrow". As is shown in figure 33. After making your selection, click the "Set" button to accomplish the reference operation.
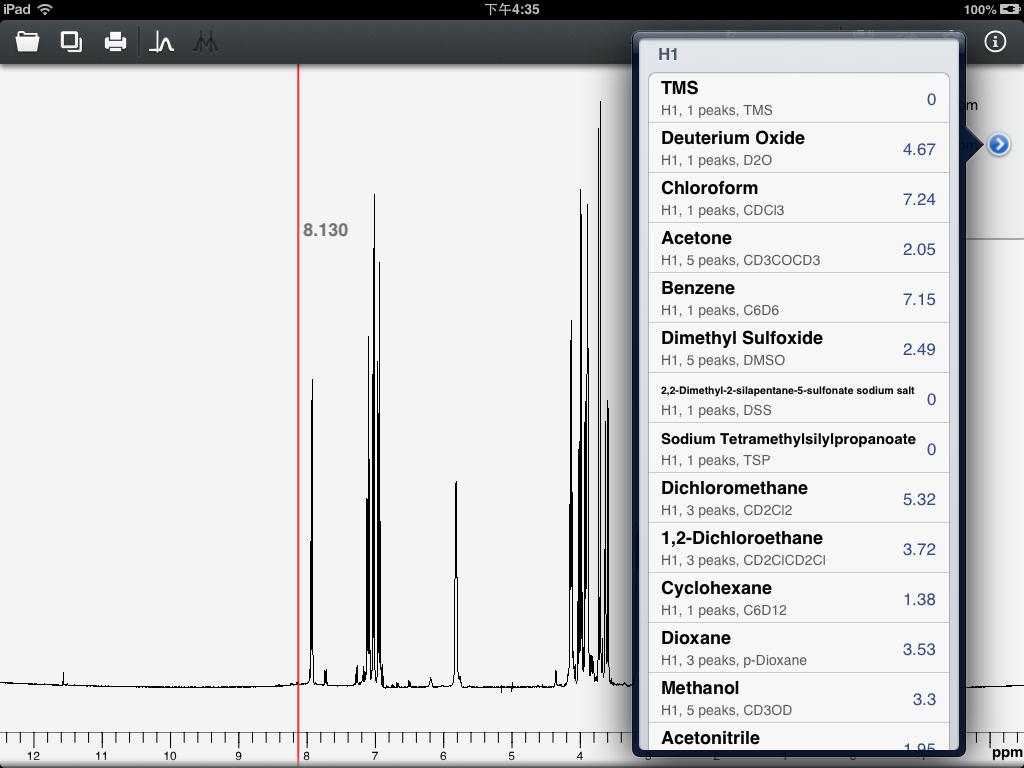
Figure 33
Users will see the interface as shown in figure 34 while do the peak finding.
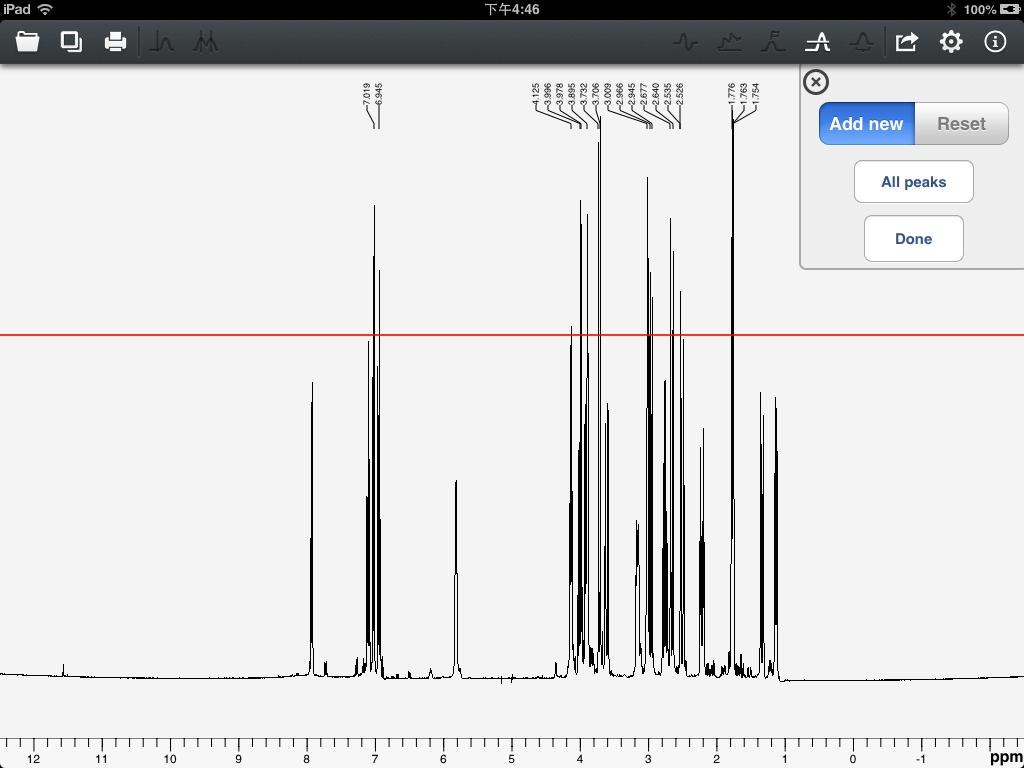
Figure 34
There is a horizontal cursor line in the view. Users can move the cursor line up and down. The peaks above the cursor line will be found out after clicking "Done" button. There are two modes of the operation "Add new" and "Reset". When users click the "Add new" segment, the original peak data will be retained. On the oppsite, clicking the "Reset" segment will delete the original peak data. If users want to check all the peak data, users can click the "All peaks" button. The interface is shown in figure 35.
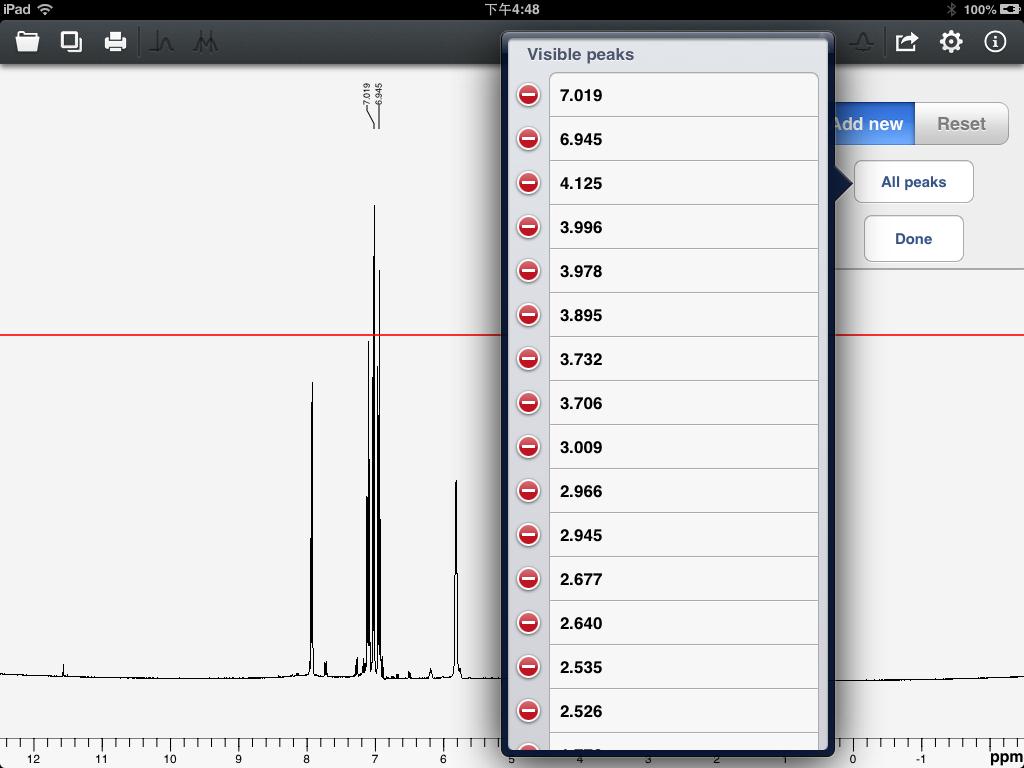
Figure 35
If users performed zooming operation, there may be a part of spectrum peaks which are invisible. And these peaks will show up in the section of "Invisible peaks". Users can click the red "delete" button to remove a certain peak data.
Users will see the integration control panel when integration operation is performed. Clicking the "Start" button, the background of the spectrum will be darken. Users can simply select the integration region by sliding to accomplish the integration operation. As is shown in figure 36.
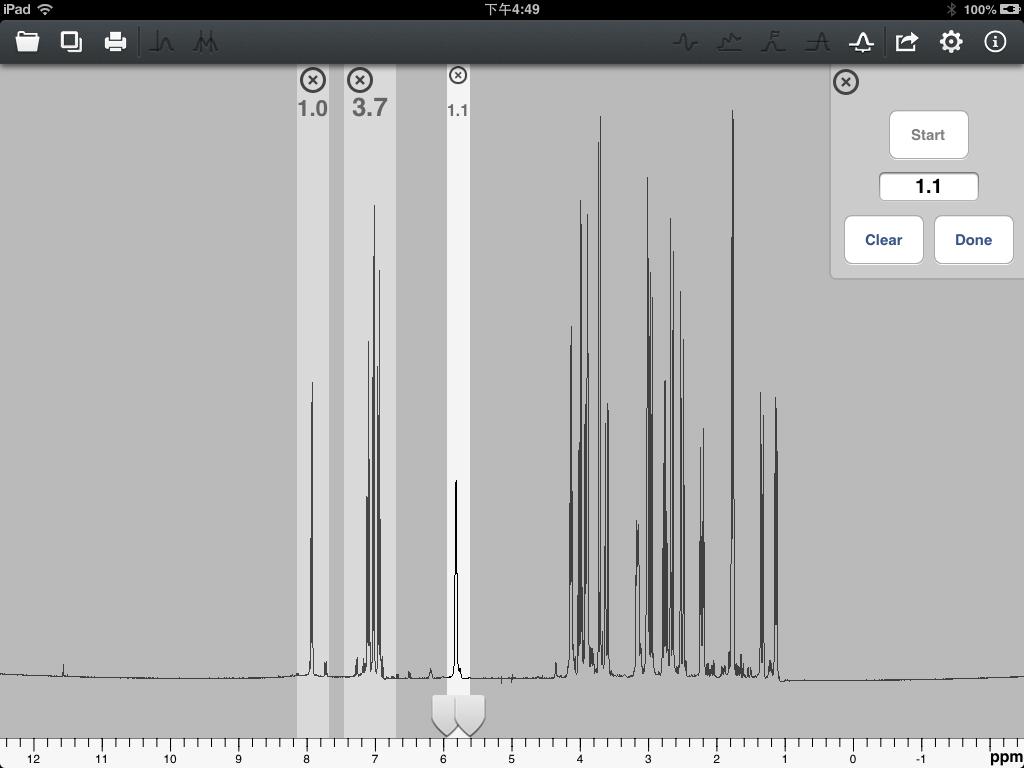
Figure 36
The brightest area is the "active area". The integration value of this area will be displayed on the integration control panel. Users can click the value field to change to another value. Also there are two removable "Tag" buttons below the active area representing the left and right range of the integration region. Users can select each one of them to move left and right to adjust the integration region. Users can click other "non-active area" to make it a "active area". Users can delete a certain integration region by clicking the "Delete" button on the top. If users click the "Clear" button, current integration data will be cleared. Once users finish selecting the integration regions, click the "Done" button to finish the integration operation. And integration values will be displayed below the integration region.
If users finish the spectrum processing, the relevant parameters can be saved to the file. Touch NMR will only save the parameters which have been used, and will not affect the other parameters.
Click the phase correction icon, the phase correction will be active. And the phase correction control panel will be called out. As is shown in figure 30.
Figure 30
Click the "Auto correction" button on the phase correction control panel, app will calculate to find perfect phase. Because the algorithm is complex, the calculation requires relatively a long time. Click the "Reset" button, the phase will be reset to initial. RP(Zero-order phase factor) varies between -180 to 180 degrees. LP(First-order phase factor) can be adjusted by rotating the cicle. And both can be tapped in a precise value by clicking the digital box. You can also select to do the "Pivot" correction. By clicking the "Highest" segment, the cursor will automatically point to the highest peak of the spectrum. At the meantime, the RP value will change according to the LP value to ensure that the phase of the highest peak remains the same. And if you click the "Cursor" segment, the phase of the point at cursor position will remains the same when you adjust the LP value.
Click the baseline correction icon, a control panel as shown in figure 31 will appear. Current version, Touch NMR only provides the function of "Auto correction".
Figure 31
The reference operation is shown in figure 32.
Figure 32
The current position is the position of the cursor, and users can move to another location by tapping in a number. Users can select the app's built-in reference data by clicking the "blue arrow". As is shown in figure 33. After making your selection, click the "Set" button to accomplish the reference operation.
Figure 33
Users will see the interface as shown in figure 34 while do the peak finding.
Figure 34
There is a horizontal cursor line in the view. Users can move the cursor line up and down. The peaks above the cursor line will be found out after clicking "Done" button. There are two modes of the operation "Add new" and "Reset". When users click the "Add new" segment, the original peak data will be retained. On the oppsite, clicking the "Reset" segment will delete the original peak data. If users want to check all the peak data, users can click the "All peaks" button. The interface is shown in figure 35.
Figure 35
If users performed zooming operation, there may be a part of spectrum peaks which are invisible. And these peaks will show up in the section of "Invisible peaks". Users can click the red "delete" button to remove a certain peak data.
Users will see the integration control panel when integration operation is performed. Clicking the "Start" button, the background of the spectrum will be darken. Users can simply select the integration region by sliding to accomplish the integration operation. As is shown in figure 36.
Figure 36
The brightest area is the "active area". The integration value of this area will be displayed on the integration control panel. Users can click the value field to change to another value. Also there are two removable "Tag" buttons below the active area representing the left and right range of the integration region. Users can select each one of them to move left and right to adjust the integration region. Users can click other "non-active area" to make it a "active area". Users can delete a certain integration region by clicking the "Delete" button on the top. If users click the "Clear" button, current integration data will be cleared. Once users finish selecting the integration regions, click the "Done" button to finish the integration operation. And integration values will be displayed below the integration region.
If users finish the spectrum processing, the relevant parameters can be saved to the file. Touch NMR will only save the parameters which have been used, and will not affect the other parameters.